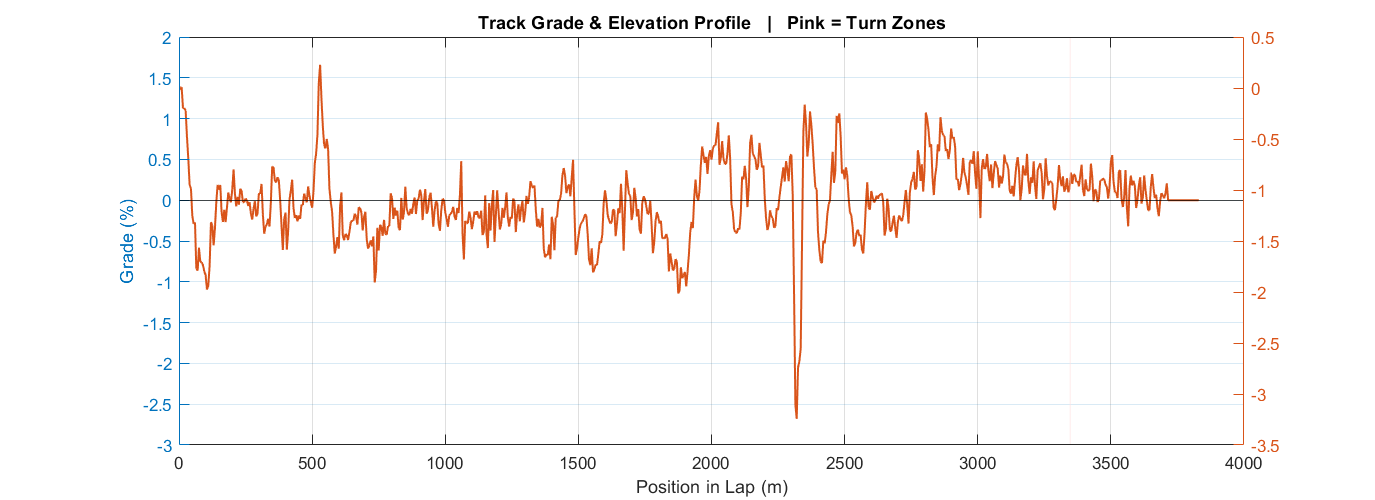
 Fig 5 — Grade % and relative elevation vs position around the lap. Pink shading marks turn zones.
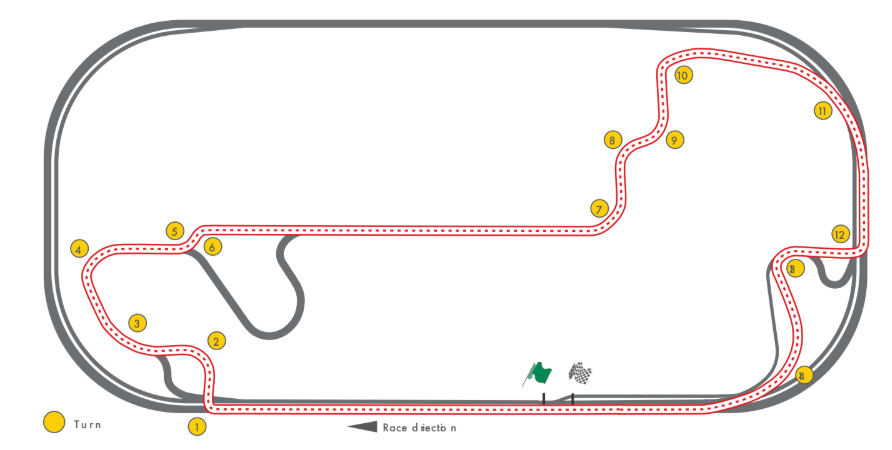 GPS track overhead with zone color coding. White = burn-coast, grey = cruise-hold, pink = turn complexes.
GPS track integration, zone-aware driver strategy, lap-based race simulation across the full IMS Infield Road Course.
V9 moves the simulation from a fixed-time run to a competition-accurate race model. Four laps of the IMS Infield Road Course are simulated under Shell Eco-Marathon Article 226 rules: 4 laps × 3832.5 m = 15,330 m total, 35-minute maximum, 7.30 m/s minimum average speed.
The main additions are a GPS-derived track profile at 5-meter resolution (767 breakpoints), a grade force term in the vehicle dynamics equation, and a zone-aware driver strategy that picks between burn-coast, cruise-hold, and corner-hold based on where the vehicle is on the lap. Output is now built around lap-level metrics — per-lap time, fuel, and km/L reported alongside Article 226 pass/fail validation.
x_Vehicle ≥ 15,330 m (4 full laps). Per-lap breakdowns reported consistent
with how Shell scoring is actually applied.
attempt_valid flag and time margin reported in command
window and plotted as title annotations on Fig 1.
F_grade = m × g × grade
included in the force balance at every simulation step. Track elevation range is 3.8 m with
max practical grade of ~0.9%.
v_target raised to 7.45 m/s
to guarantee minimum average speed ≥ 7.30 m/s (Article 226). Estimated lap time 497.7 s × 4
= 1991 s, giving a 109 s margin against the 2100 s limit.
m = 100 kg and G = 10
pending final drivetrain assembly measurements.
| Total lap distance | 3,832.5 m |
| Turn complexes detected | 19 (curvature threshold 0.5 deg/m) |
| Zone 1 — long straight (burn-coast) | 1,325 m (34.6%) — includes main 1325 m straight |
| Zone 2 — short straight (cruise-hold) | 1,800 m (47.0%) |
| Zone 3 — turn zones (corner-hold) | 705 m (18.4%) |
| Elevation range | 3.8 m total | net change ~0 m (closed loop) |
| Max practical grade | ~0.9% (brief) — grade force term included in dynamics |
| Tightest turn | R = 19.3 m at x ≈ 3132–3176 m → v_corner = 7.54 m/s |
Fig 5 — Grade % and relative elevation vs position around the lap. Pink shading marks turn zones.
GPS track overhead with zone color coding. White = burn-coast, grey = cruise-hold, pink = turn complexes.
| Zone | Condition | Strategy | Speed Reference |
|---|---|---|---|
| 1 | Long straight (>200 m) | Burn-Coast (Stateflow hysteresis) | v_low=7.5 m/s / v_high=8.0 m/s |
| 2 | Short straight (<200 m) | Cruise-Hold | v_target = 7.45 m/s |
| 3 | Turn / corner zone | Corner-Hold | track_v_limit (per-turn, 7.54–8.50 m/s) |
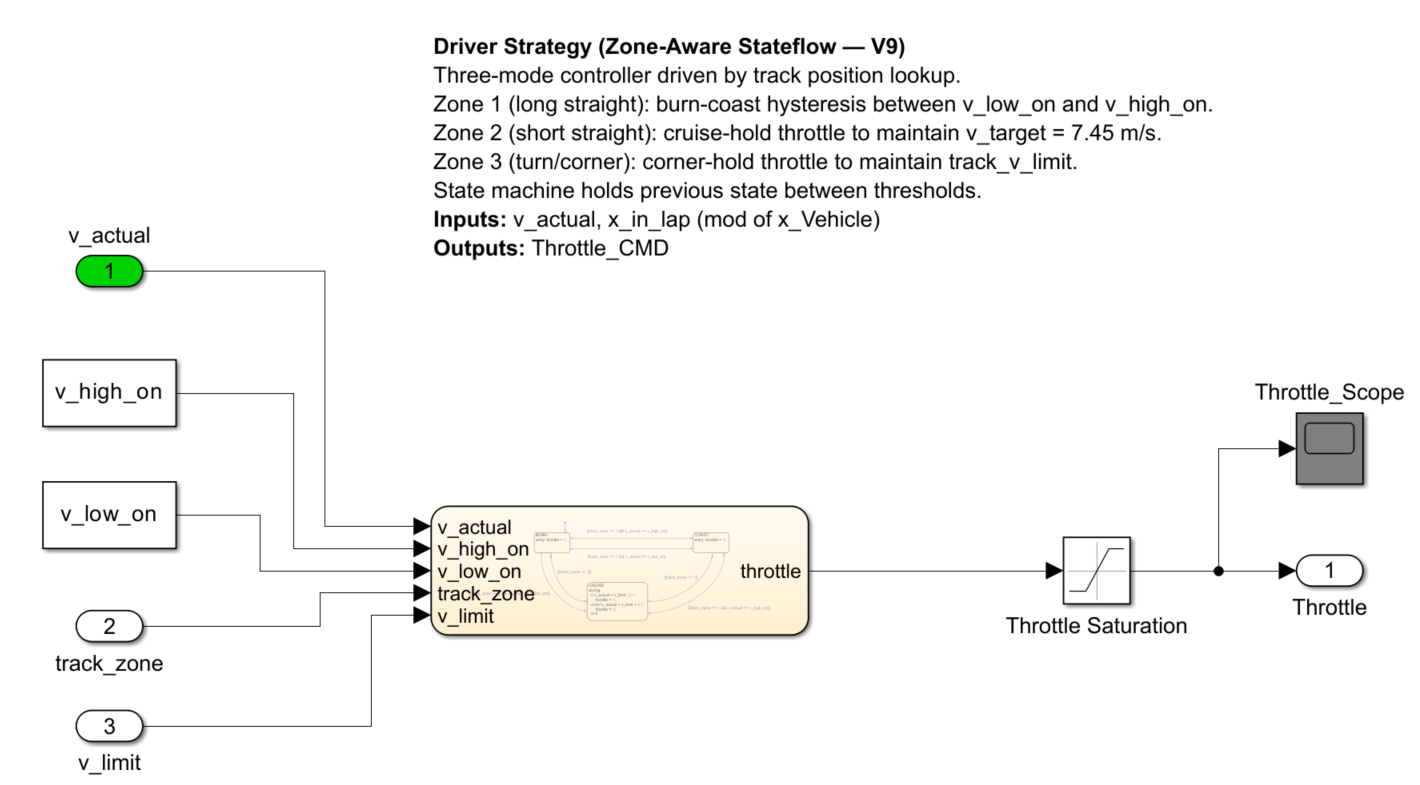 Driver strategy block: track zone lookup feeds the mode selector, which routes to Stateflow burn-coast or cruise/corner hold.
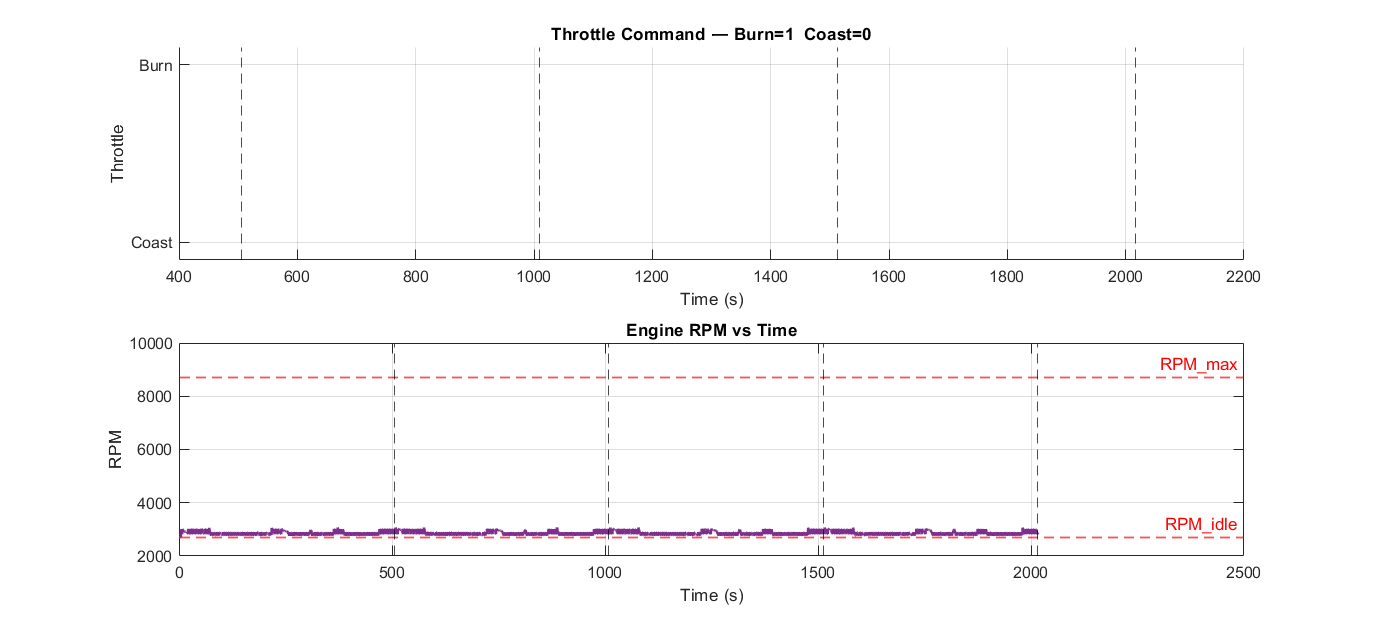 Fig 4 — Throttle state (burn/coast, top) and engine RPM with idle/max limits (bottom). Lap markers shown as dashed lines.
Baseline: v_low=7.2, v_high=7.7, v_target=7.45 m/s, G=10, m=100 kg, Cd=0.30, 4 laps × 3832.5 m.
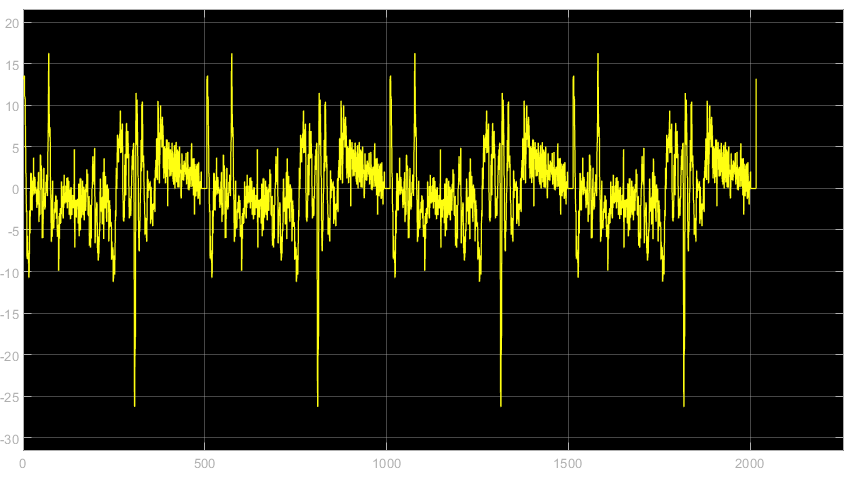
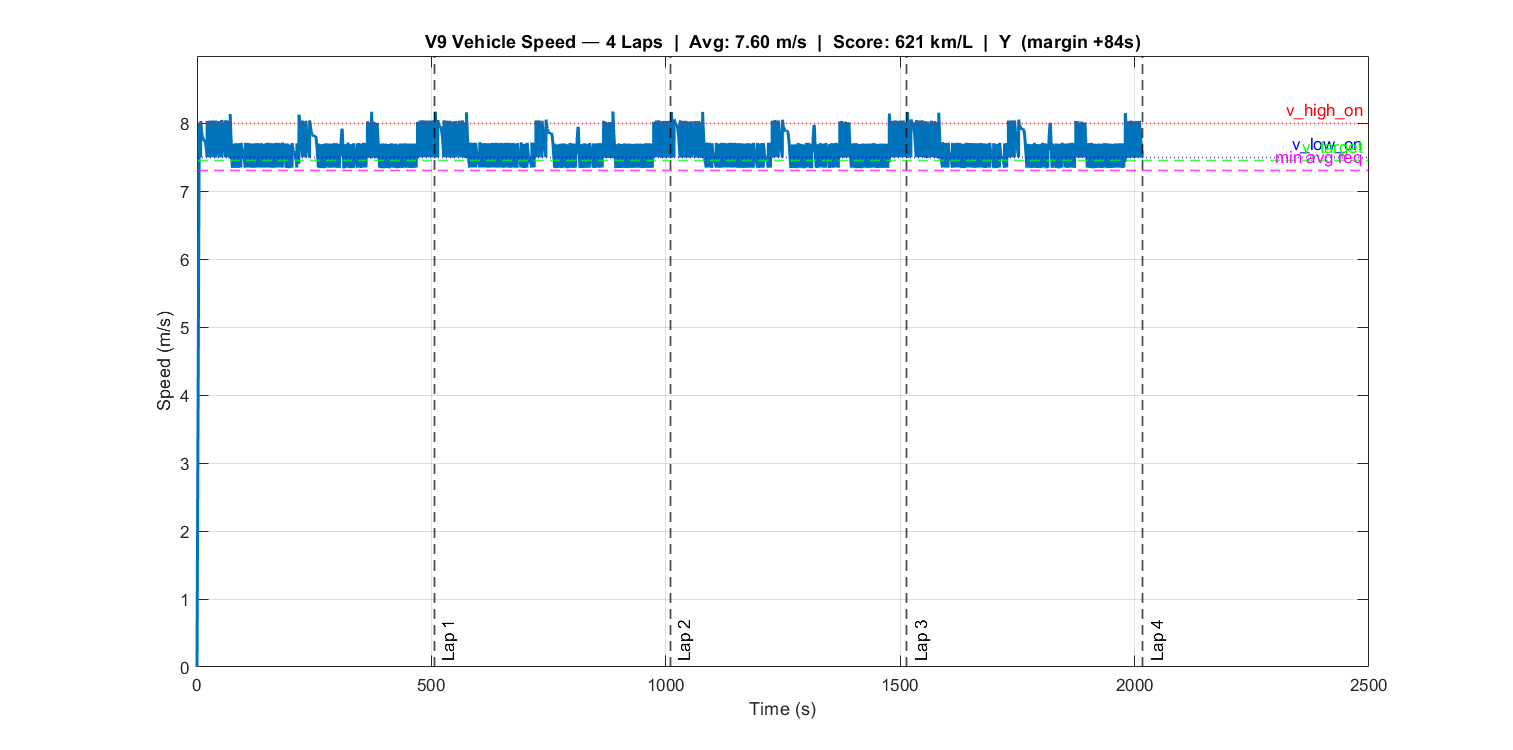 Full race speed trace across all four laps. v_high_on (red), v_low_on (blue), v_target (green), v_min_avg (magenta). Lap markers dashed. Title annotations show avg speed, Shell Score, pass/fail status, and time margin.
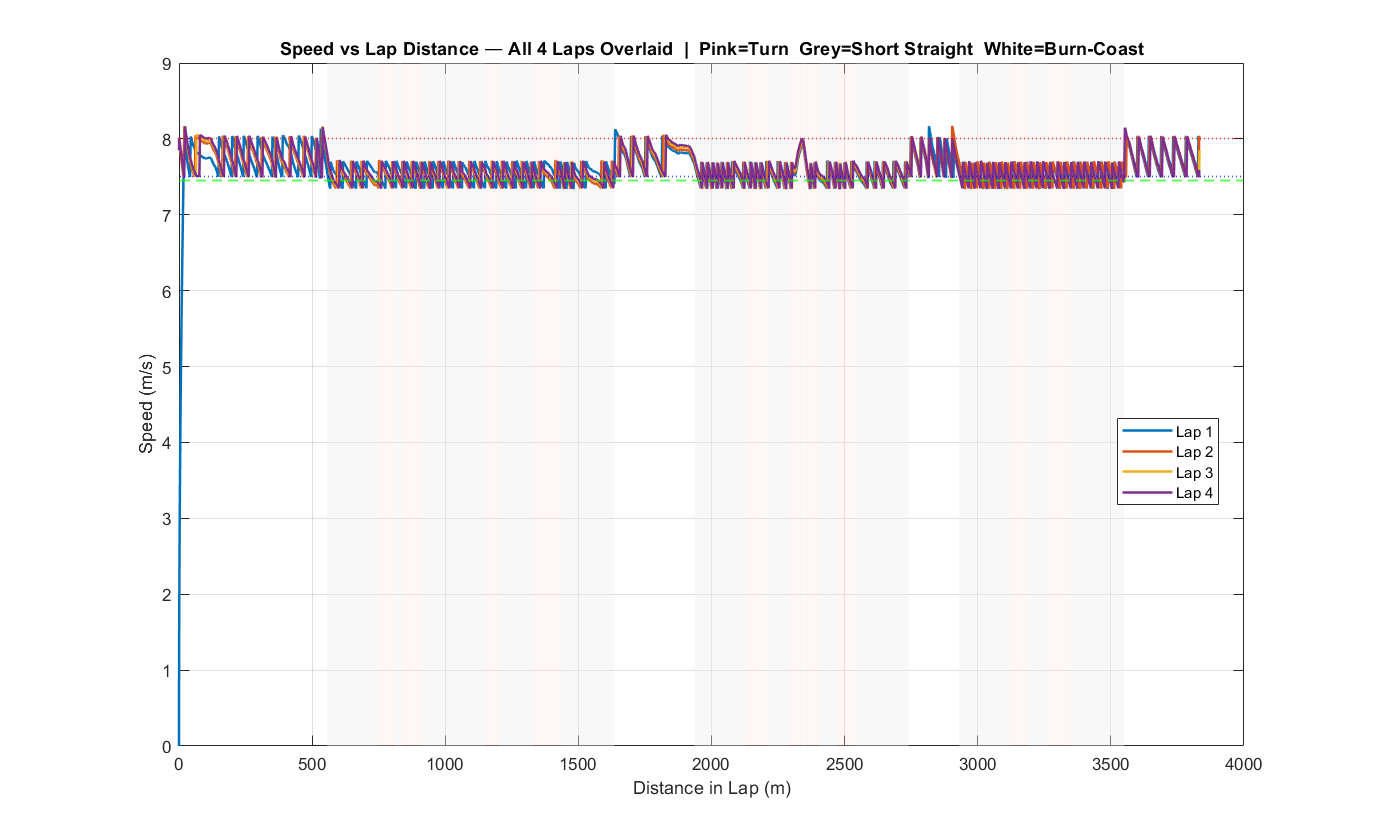 All four laps on a single distance axis with zone shading in the background. Consistent lap profiles confirm steady-state is reached by lap 1.
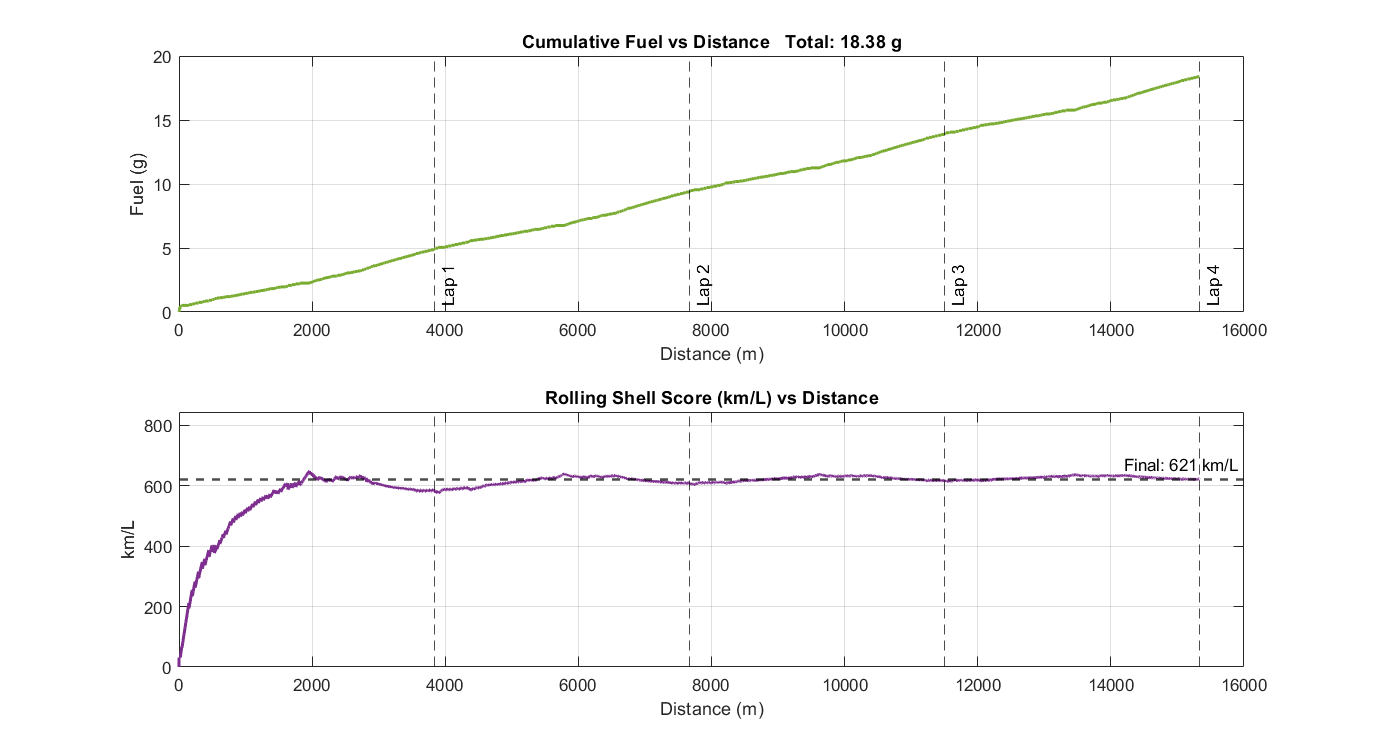 Cumulative fuel (g, top) and rolling Shell Score (km/L, bottom) vs total distance. The stepped fuel profile confirms no energy leakage during coast phases. km/L converges after lap 2.
Throttle command (top) and engine RPM with idle/max limits marked (bottom).
Cumulative fuel (g, top) and rolling Shell Score (km/L, bottom) vs total distance. The stepped fuel profile confirms no energy leakage during coast phases. km/L converges after lap 2.
Throttle command (top) and engine RPM with idle/max limits marked (bottom).
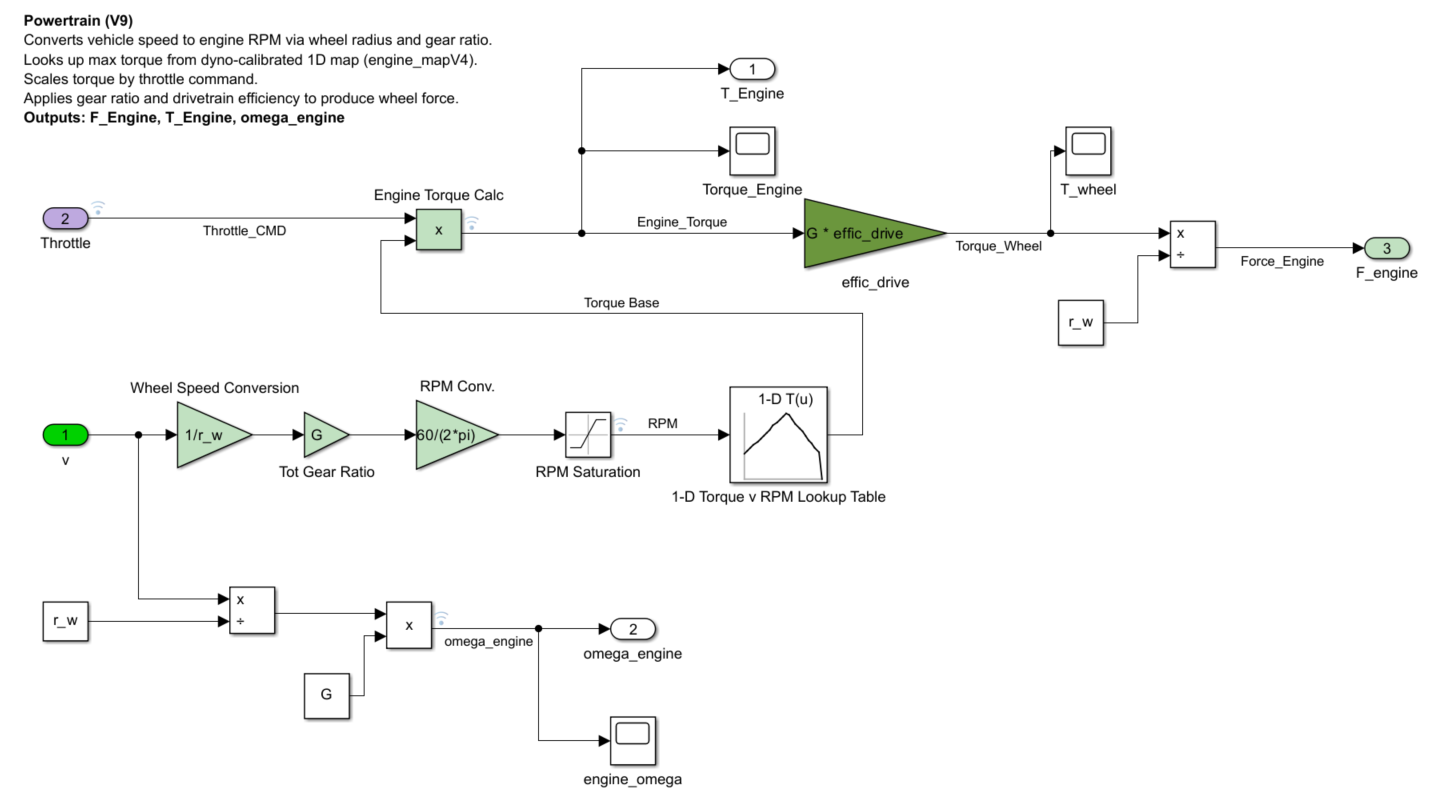 Powertrain subsystem: torque map lookup, gear ratio G, drivetrain efficiency, wheel force output.
Grade % (left axis) and relative elevation in meters (right axis) vs position. Pink shading marks turn zones.
Powertrain subsystem: torque map lookup, gear ratio G, drivetrain efficiency, wheel force output.
Grade % (left axis) and relative elevation in meters (right axis) vs position. Pink shading marks turn zones.
 F_grade = m × g × grade vs lap position. Shows peak resistive and assistive grade force values around the circuit.
TOP-class aerodynamics (Cd=0.12) vs current estimated drag (Cd=0.35) running simultaneously on the IMS lap. Lower drag means longer coast phases, fewer burn cycles, and a real position gap that opens over the lap.
| Rank | Team | Score (km/L) | Notes |
|---|---|---|---|
| — | BYU (2024 reference) | 995 | Fully covered wheels, professional build |
| 1 | Mater Dei HS | 718 | 2025 Americas champion |
| 2 | IFRS Erechim | 629 | |
| 3 | Michigan Tech | 323 | |
| 4 | Cedarville University | 315 | |
| 5 | Penn St Behrend | 177 | |
| 6 | Schurr HS | 92 | |
| — | This vehicle (V9 simulation) | 621.3 km/L | m=100 kg, Cd=0.30, G=10, effic=0.20 (fixed) |
Five independent sweeps on the full IMS lap-distance simulation. All scored in km/L. Baseline: 621.3 km/L.
v_low = 7.0 m/s, v_high = 7.5 m/s → 628.0 km/L | t_total = 2039.5 s (margin +61 s)
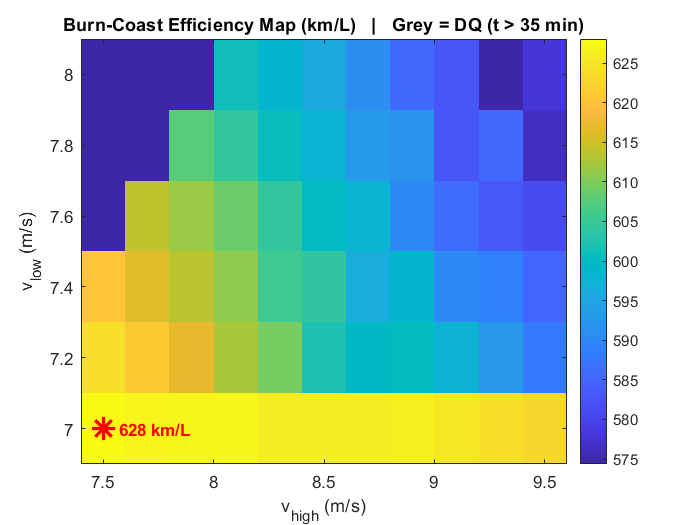 Sweep 1 — 2D heat map: v_low (y-axis) vs v_high (x-axis), color mapped to km/L.
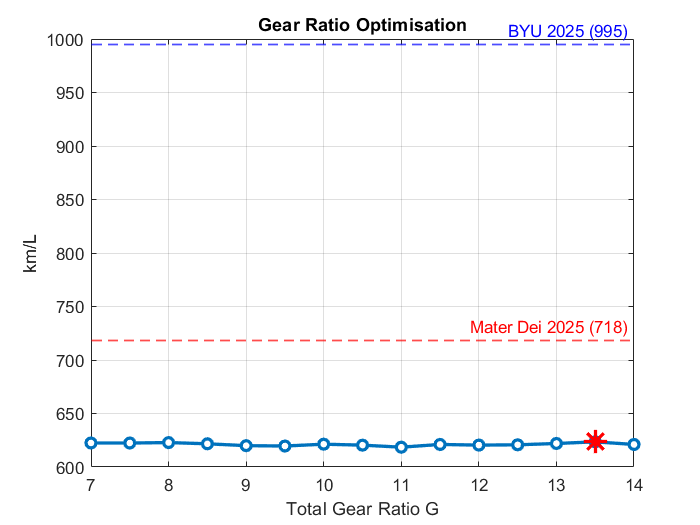 Sweep 2 — Gear ratio has minimal efficiency impact across G=7–14. Set it to keep RPM in range and move on.
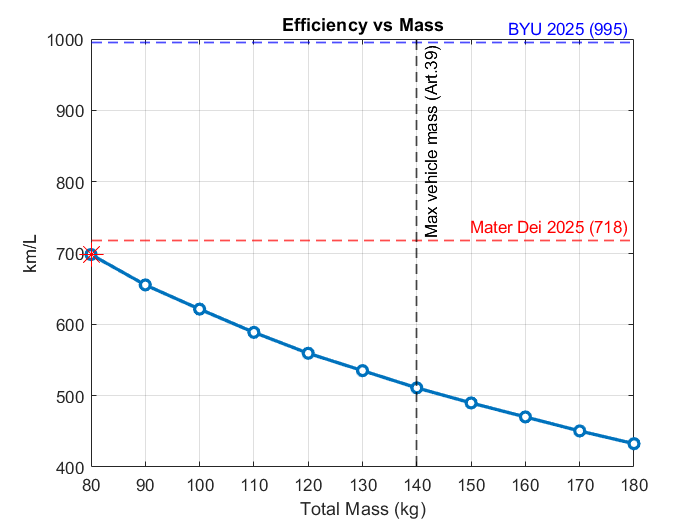 Sweep 3 — Monotonically decreasing. Each 10 kg costs roughly 25–30 km/L.
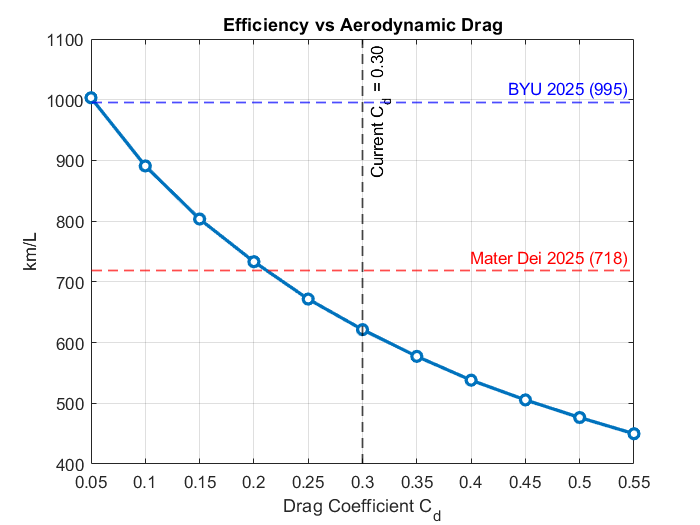 Sweep 4 — Near-linear improvement as drag drops. Cd=0.15 reaches Mater Dei territory.
Engine efficiency swept from 8% to 34%. The relationship is perfectly linear — Shell score scales directly with efficiency. Every 2 percentage points is worth approximately 62 km/L.
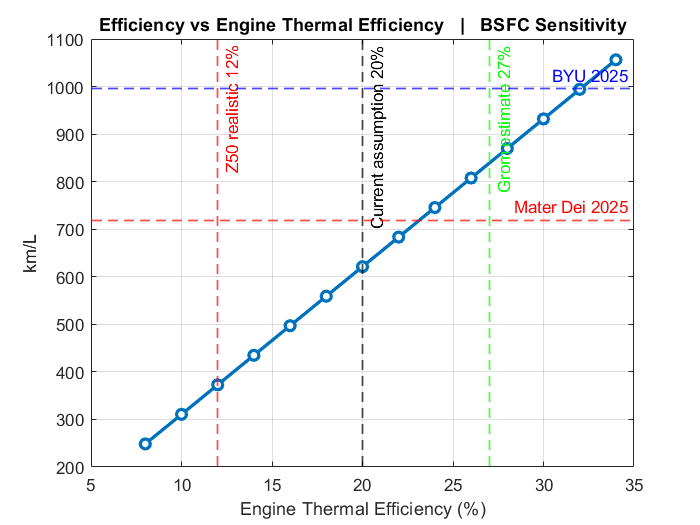 Sweep 5 — Perfectly linear. Score scales proportionally with efficiency. Baseline at 20% = 621 km/L. Each 2% gain is worth ~62 km/L.
| η_eng | km/L | Context |
|---|---|---|
| 8% | 248.5 | |
| 16% | 497.1 | |
| 20% | 621.3 | ← baseline |
| 22% | 683.5 | Mater Dei range |
| 24% | 745.6 | Mater Dei+ |
| 32% | 994.1 | BYU 2024 range |
=== Shell Eco Run Results (V9) ===
Total distance:    15330.0 m
Total time:        2016.2 s  (33.6 min)
Time margin:       +83.8 s
Attempt valid:     YES ✓
Avg speed:         7.604 m/s
Shell Score:       621.3 km/L

--- 2025 Field Comparison ---
  vs Mater Dei (1)   718.0 km/L  → 86.5%
  vs IFRS Erechim    629.0 km/L  → 98.8%
  vs Michigan Tech   323.0 km/L  → 192.4%

--- Per-Lap Breakdown ---
Lap  Time(s)  LapTime  AvgSpd  Fuel(g)  km/L
1    505.8    505.8    7.578   4.911    581.4
2    1009.3   503.5    7.611   4.506    633.6
3    1512.8   503.5    7.612   4.486    636.5
4    2016.2   503.4    7.613   4.478    637.5

F_Engine check:    CLEAN — no leakage during coast
Coast shape:       CURVED (exponential) — physics correct
Lap 1 fuel (4.91 g) is higher than laps 2–4 (~4.48–4.51 g) because the vehicle accelerates from rest at t=0. Laps 2–4 are within 0.6% of each other — steady-state cycling is established by lap 2. The max uphill grade of 1.66% produces a grade force (16.28 N) that is 1.8× flat rolling resistance, making it the dominant terrain feature on the IMS infield circuit and the main driver of the lap 1 vs lap 2+ fuel difference.
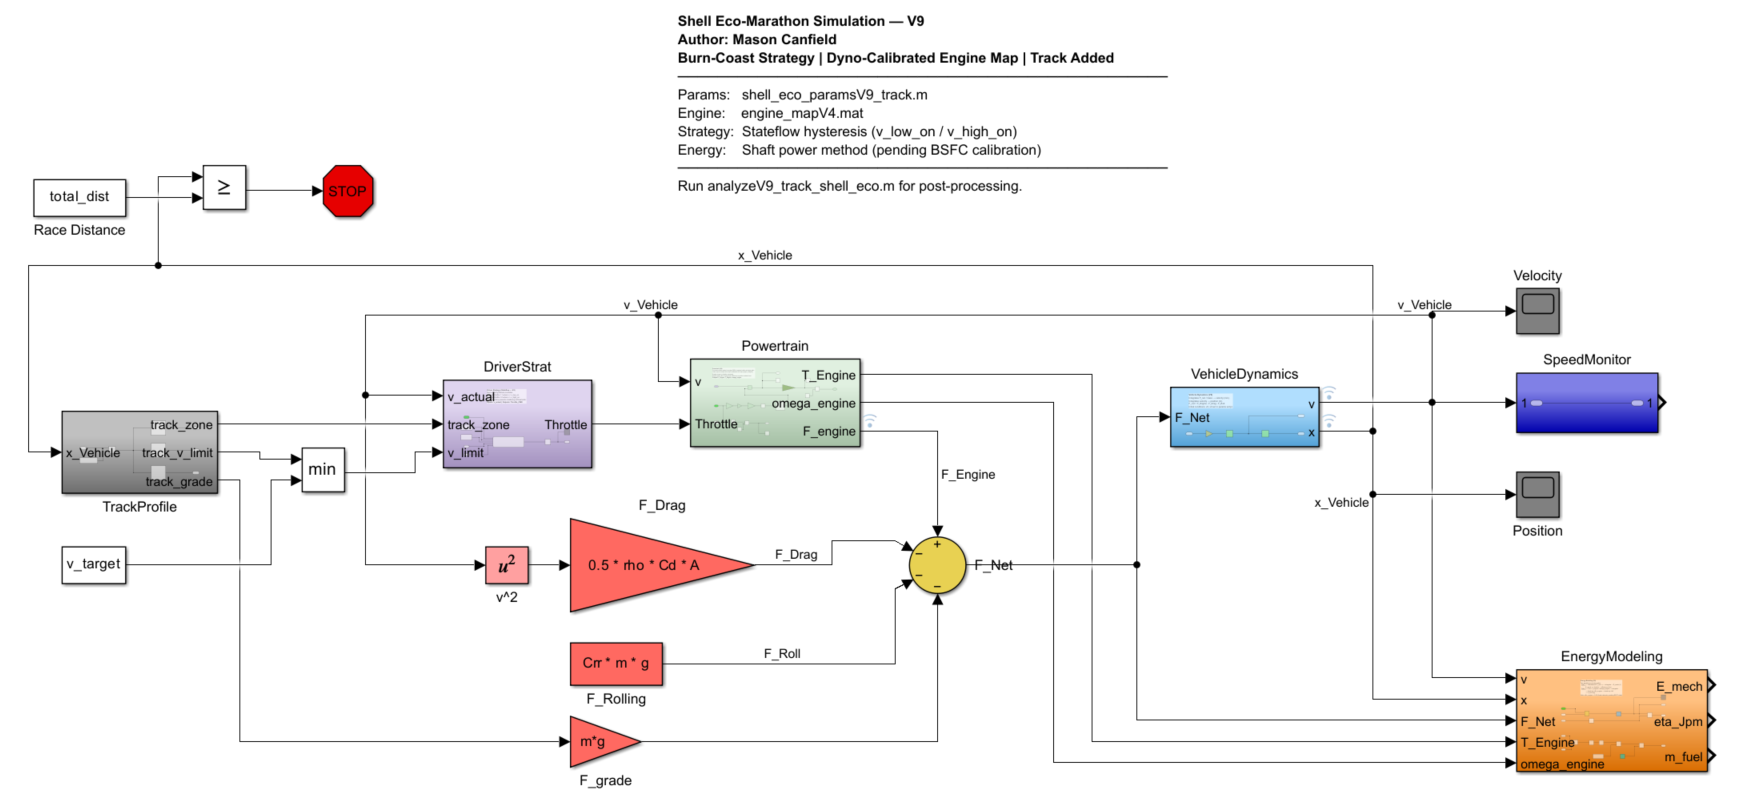 Full system overview: DriverStrat (zone-aware), Powertrain, VehicleDynamics with F_grade, EnergyModeling, and lap counter.
Powertrain subsystem: torque map lookup, gear ratio, drivetrain efficiency, wheel force output.
Zone-aware driver strategy: track zone lookup feeds the mode selector, which routes to Stateflow burn-coast or cruise/corner hold.
Full system overview: DriverStrat (zone-aware), Powertrain, VehicleDynamics with F_grade, EnergyModeling, and lap counter.
Powertrain subsystem: torque map lookup, gear ratio, drivetrain efficiency, wheel force output.
Zone-aware driver strategy: track zone lookup feeds the mode selector, which routes to Stateflow burn-coast or cruise/corner hold.
F_brake for corner deceleration phases